

IMPROVING LIVES THROUGH DATA ECOSYSTEMS
Four facts about the mining industry (2019)
In the third of four detailed industry reports released this month, Stats SA takes a deep dive into the mining industry. The report, which covers the results of a census conducted in 2019, provides detailed statistics on mineral production, finances, employment, and exports and imports.
The mining census was conducted previously in 2012 and 2015.
- Coal dominates production
South African coal production amounted to 306 million metric tons in 2019. To give some sense of the scale of how large this is, the graphic below represents the production (in metric tons) of the various minerals. Each block in the graphic represents about 407 000 metric tons, roughly the weight of 2 710 blue whales. Coal covers 752 of these blocks, or about 75% of the total mass of all minerals produced. The second biggest mineral was iron ore, followed by chromium and manganese ore.
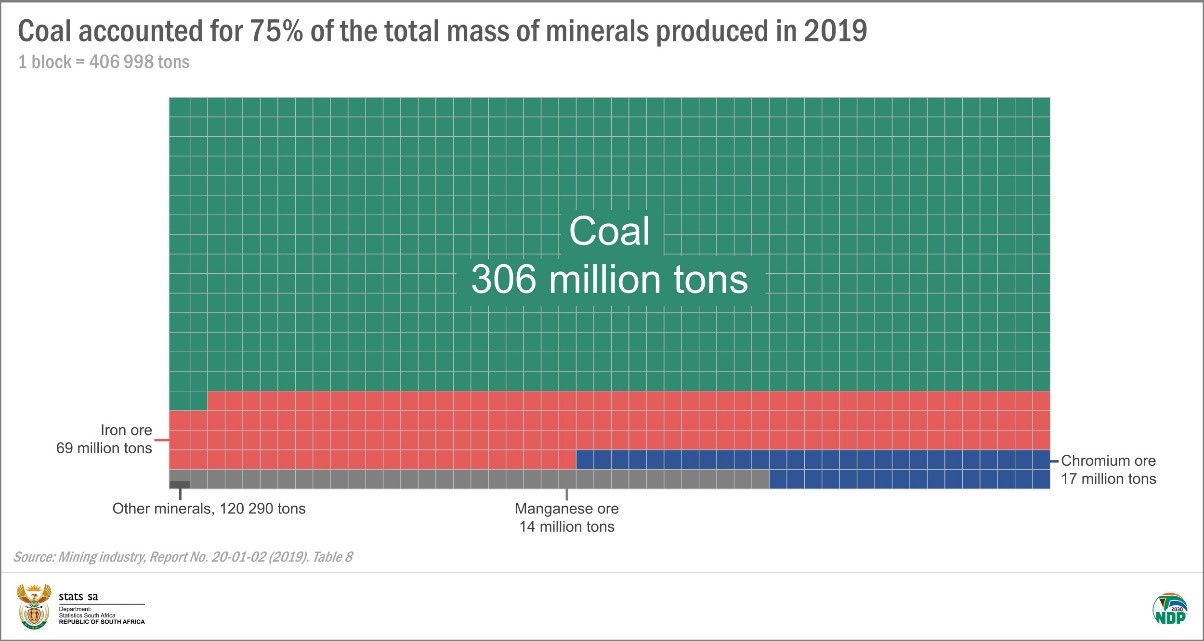
Notice the tiny portion of the block on the lower left side of the graphic. This includes all other minerals, including nickel (63 379 metric tons), copper (56 534 metric tons), platinum (138 metric tons), gold (97 metric tons) and other smaller commodities.
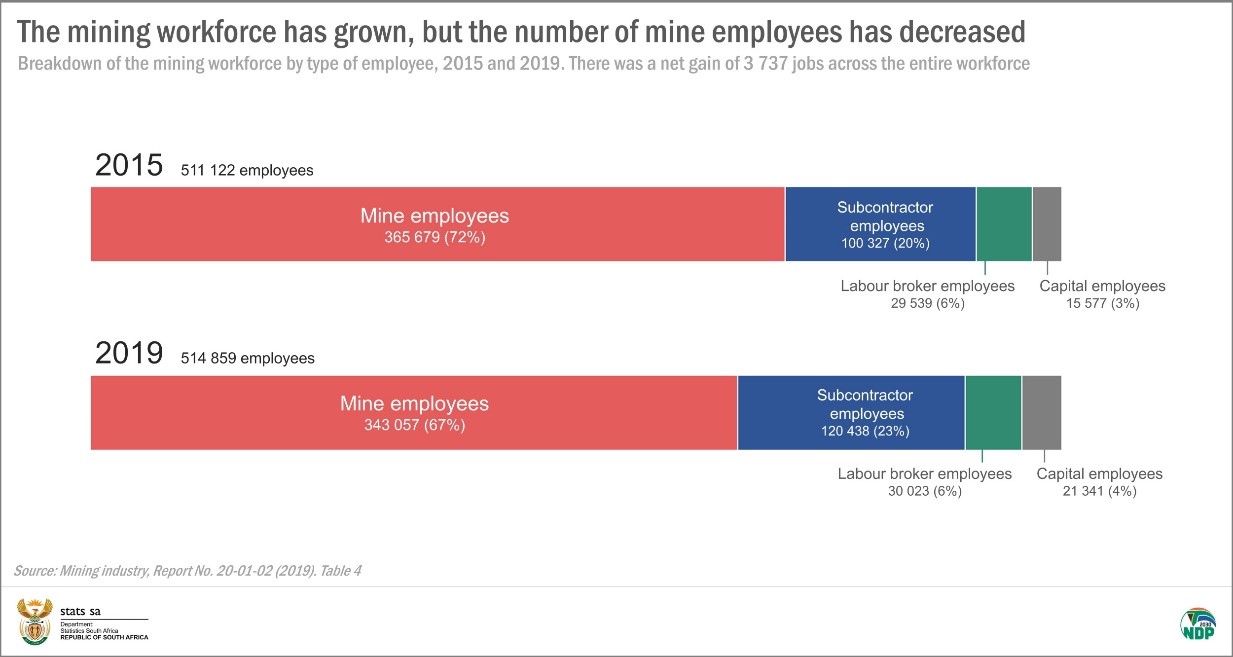
- Employment has gone up, but not for mine employees
Extracting and processing all these minerals requires a great deal of machinery and manpower. The South African mining industry employed 514 859 individuals in 2019. If the mining sector is represented by a group of 100 workers, 39 are employed in the platinum group metals sector, 21 in the coal sector and 20 in the gold sector. The iron ore sector is a much smaller recruiter, employing 5 of every 100 employees. The remaining 15 employees work across smaller operations, which include the production of other minerals, lime works and stone quarrying.
The employment figures from the report show that the mining workface expanded by 3 737 individuals in the 2015–2019 period. A closer look shows that this increase in employment was due to a rise in the number of employees from subcontractors and labour brokers. The number of capital employees – individuals working on projects that fall outside the daily scope of business – also increased over this period.
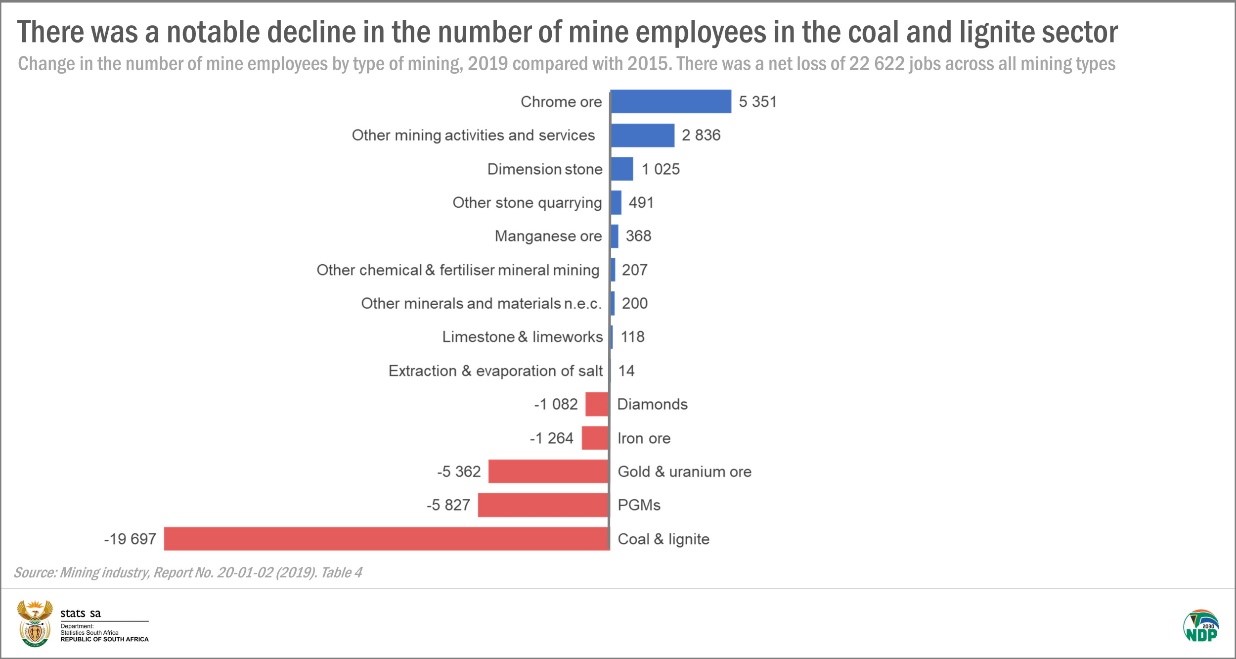
However, there was a notable decline in the number of workers employed directly by mines. Mine employees decreased by 22 622 individuals. If we focus squarely on these jobs, the bulk were lost in the coal & lignite sector, followed by platinum group metals and gold & uranium.
On a provincial level, the mining industry recorded employment decreases in North West, Mpumalanga, and KwaZulu-Natal in 2019 compared with 2015. North West, Limpopo and Mpumalanga have the largest mining workforces. This is not surprising, as mining is the largest industry in all three provinces, according to provincial gross domestic product (GDP) estimates.1
- Palladium and rhodium record large sales increases
Stats SA recently reported that platinum group metals had, for the first time in a decade, overtaken coal as the most significant contributor to total mining sales.2 This is largely due to the rise in the prices of palladium and rhodium, which pushed up sales.
The value of palladium sales increased by R23,4 billion and rhodium by R15,7 billion in 2019 compared with 2015.
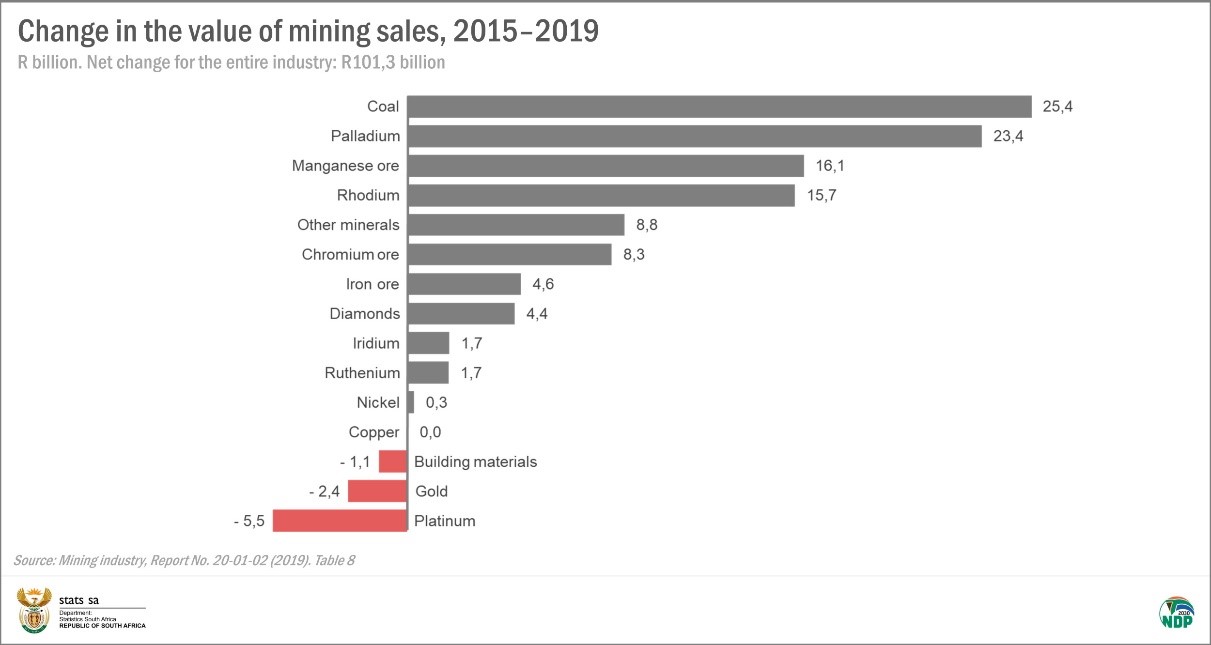
Interestingly, the data show that South Africa is producing less palladium and rhodium than it did in 2015, showing the extent to which prices have driven sales growth.
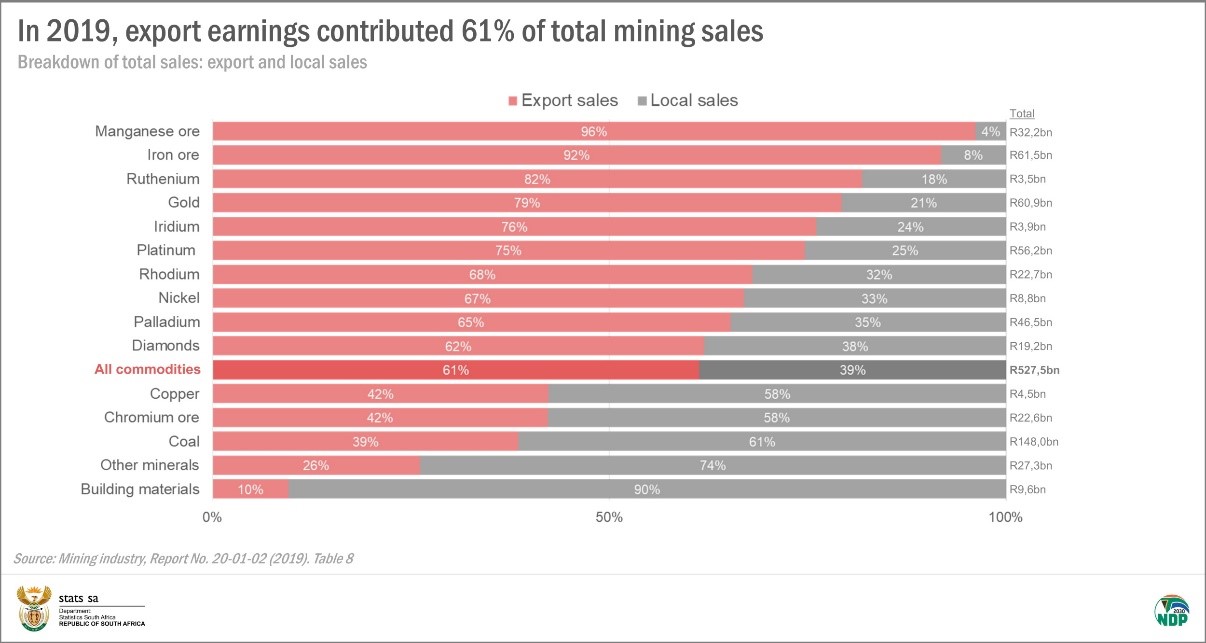
- Almost two-thirds of mining sales are from abroad
The industry generated R527,5 billion in total sales in 2019, with 61% (R323,8 billion) sourced from outside the country. Breaking this down by commodity, export sales dominated the manganese ore market (96%), while 61% of coal sales were local.
For more information, download the Mining industry, 2019 report and media presentation here.
1 Stats SA, When talking economics, consider the provinces (read here).
2 Stats SA, PGM sales surge due to higher prices (read here).
Similar articles are available on the Stats SA website and can be accessed here.
For a monthly overview of economic indicators and infographics, catch the latest edition of the Stats Biz newsletter here.